Search

When the financial world pauses to analyze the bond market, few indicators stir as much debate as the inverted yield curve. This phenomenon has earned a reputation as a historically reliable recession indicator, captivating economists, investors, and policymakers alike. By tracing the relationship between short-term and long-term government bond yields, we can unearth powerful signals about the economy’s trajectory and prepare for potential downturns.
A yield curve graph plots yields of bonds with equal credit quality but varying maturity dates. In a normal yield curve pattern, shorter maturity bonds yield less than longer-term securities, reflecting the risk premium investors demand for tying up capital over a prolonged period. Conversely, an inverted yield curve phenomenon emerges when short-term bond yields exceed long-term yields, defying historical norms and raising immediate alarm bells.
Most analyses focus on U.S. Treasury securities such as the 3-month, 2-year, and 10-year bonds. When, for instance, the 3-month yield rises above the 10-year yield, this inversion signals that investors anticipate lower interest rates in the future, often stemming from expectations of slowing economic growth and forthcoming central bank rate cuts.
At its core, inversion reflects market psychology and demand dynamics. When investors forecast a recession, they flock to purchase long-dated government bonds to lock in yields before rates fall. This heightened demand pushes long-term yields downward while short-term yields climb, driven by ongoing monetary policy and market supply and demand imbalances.
Empirical evidence underscores the inverted curve’s predictive prowess. Since the 1970s, every U.S. recession has been foreshadowed by an inversion between short- and long-term Treasury yields. Although timing varies, the average lag between inversion and the onset of recession hovers around 12 months, with cases ranging from as little as 2 months up to nearly 24 months.
The most notable example occurred in 2006 when the 2-year Treasury yield surpassed the 10-year rate. Roughly a year later, the Great Recession began in December 2007. Such patterns repeat across multiple economic cycles, granting inversion a near-mythical status among leading indicators.
When the curve inverts, financial institutions confront compressed profit margins since banks typically borrow short-term and lend long-term. As the spread narrows or turns negative, net interest margins shrink, driving institutions to tighten credit standards and curtail lending activity. This behavior further amplifies economic deceleration.
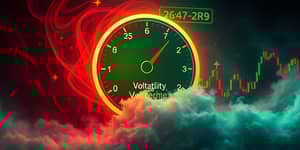
On the investor side, equity markets often undergo increased volatility as participants reassess risk exposure and reposition portfolios toward defensive assets. Shifts into government bonds dampen yields even further, reinforcing the inversion and fueling a self-reinforcing cycle of caution in financial markets.
While the U.S. yield curve wields considerable predictive power, its efficacy varies internationally. Countries such as Canada and Germany display similar patterns, while markets in Japan or Italy produce more erratic signals due to differing credit risks, central bank policies, and investor bases. Understanding these nuances is essential before extrapolating U.S. findings to global economies.
Critics caution that not every inversion heralds a deep recession; sometimes, it may presage a moderate slowdown or a strategic policy adjustment by central banks. Additional indicators—such as unemployment rates, consumer sentiment, and manufacturing surveys—should complement yield curve analysis for a more comprehensive economic outlook.
As of 2025, the U.S. Treasury yield curve has inverted multiple times in the aftermath of pandemic-era liquidity interventions and subsequent policy normalization. In early 2024, a brief inversion ignited headlines and stoked fears of a looming downturn, only to recede later in the year. Despite this reprieve, ongoing geopolitical tensions, inflationary pressures, and central bank policy shifts continue to keep markets on edge.
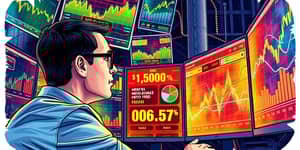
Investors remain vigilant, tracking both the steepness and duration of any inversion. A prolonged inversion lasting several months carries greater weight than a transient dip, serving as a stronger harbinger of potential economic distress.
Given its reputation as a cornerstone of economic forecasting, the inverted yield curve should not prompt panic but rather measured reassessment of risk exposures and strategic allocation adjustments. Analysts recommend examining the curve alongside other macroeconomic indicators to form a holistic perspective.
For policymakers, yield curve signals can inform the timing of rate cuts or fiscal interventions. Although central banks should not rely solely on inversion, recognizing its historical significance allows for more agile and preemptive policy responses in the face of evolving economic conditions.
Inverted bond yield curves represent one of the most closely watched indicators of economic health. By illuminating investor expectations about interest rates and growth prospects, they offer a powerful lens through which to anticipate recessions. Whether you are a professional money manager, a corporate strategist, or an informed individual investor, integrating yield curve analysis into your toolkit can enhance decision-making and foster resilience in uncertain times.
Ultimately, while no indicator is infallible, the recurring pattern of inversions preceding recessions for over four decades underlines the curve’s enduring value. Staying alert to its signals, alongside other key metrics, equips market participants to navigate economic cycles with greater confidence and foresight.
References